IELTS Writing Task 1 questions
IELTS Writing Task 1 Questions
The chart below shows nitrogen oxide emissions emitted by different forms of transport. Summarise the information by selecting and reporting the main features, and make comparisons where relevant.
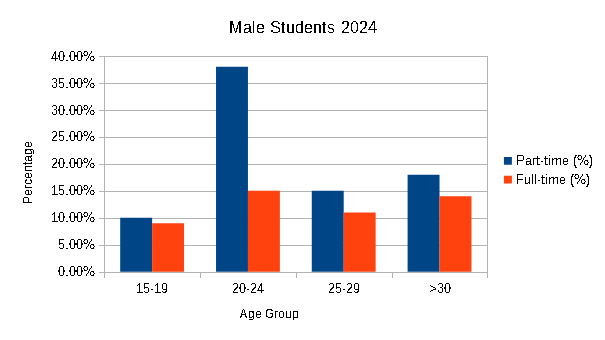
The two bar charts below show the percentage of male and female students in full-time and part-time university education in the UK in 2024.
Summarise the information by selecting and reporting the main features, and make comparisons where relevant.


Comments